Quantum State Visualizer: Turning Functions into Plots
2025-06-15
Why I Chose This Project
I have been interested in quantum computing for a while, and I really wanted to work on a project to learn more and gain more experience in this field. As such I suggested a few projects to my professor and he chose this one. He had already been working on a research projects with other researchers, and they were looking for a way to visualize quantum states. More preciesely, they wanted to visualize the Wigner funcions in 2D and 4D (so 1 mode and 2 modes).
What I Learned
Prior to this project, I didn't have much experience with quantum computing, I had only read books on quantum physics or quantum computers. So it was took on this project without knowing much. During the first few weeks, I researched key concepts and theories such as Heisenberg's uncertainty principle, Wigner function and their Gaussian form and the Wasserstein distance. With the help of my co-supervisor, I was able to understand these concepts. Though I still have a long way to go before I can say I fully understand quantum computing, I feel like I have a good grasp of the basics now.
Challenges
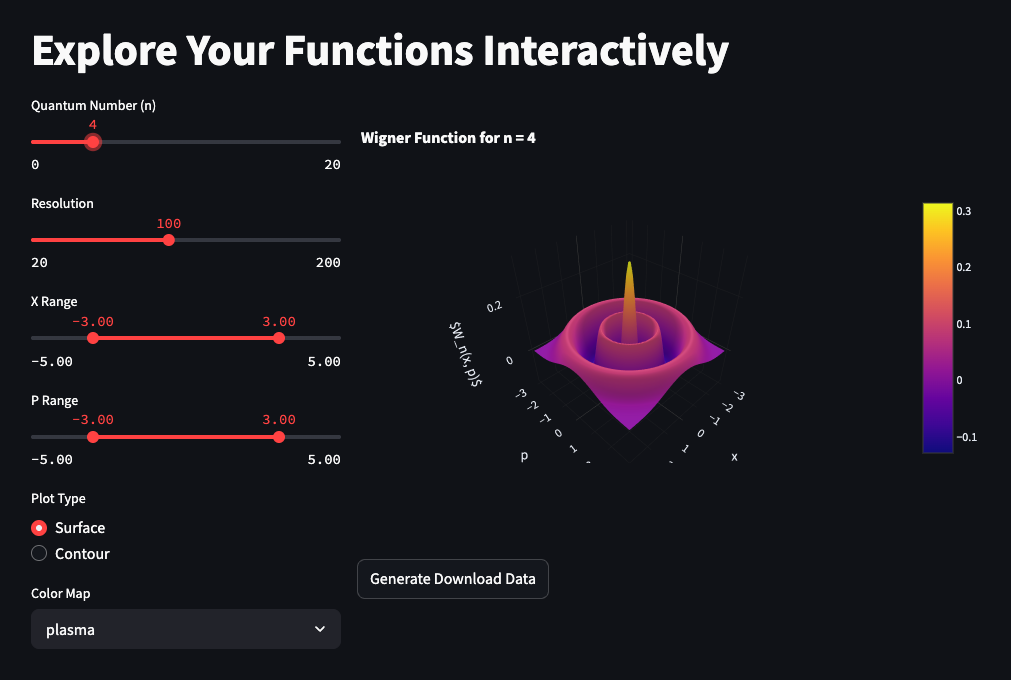
Besides the initial learning curve, visualzing higher-dimensional data was a challenge. Allthough the highest dimension that I had to visualize was 4D, I had to find a way to represent this data in a way that is easy to understand. Addiotionally, the user experience was also a challenge that we worked on iteratively. We opted for an interactive web application where the user could select different functions, visualize them and change their parameters.
Tools that I Used
For this project, the main tool was Python. I used Streamlit to build the web application, and I used NumPy and SciPy to perform the calculations. I also used Plotly to create the 3D plots to visualize the Wigner functions in 2 modes. And I built a simple HTML landing page to explain how the platform works and what it offers. The landing page is hosted using Vercel, and the we application is hosted with Heroku.
Checkout the Project
For more detail, you can read the small paper that I wrote about this project:
You can find the project through this link: Quantum State Visualizer
You can finc the projects repository at: Interactive Function Explorer